Over the 20 years to June 2025, a typical Australian investment home returned 9.16% a year; listed property trusts (AREITs) returned 5.05%. In the AREITs vs direct property debate, that gap is real, but it is not the whole story. Property owners usually borrow 80% of the price, put in $190,000+ up front, and cannot sell a bedroom when they need cash. An AREIT investor can start with $500, sell in seconds, and owns a slice of hundreds of shopping centres, warehouses and offices.
No size fits all: direct property wins on long-run return when you can carry the debt, the costs and the concentration; AREITs win on access, liquidity, diversification and simplicity. The rest of this article shows the numbers behind that sentence.
1. What an AREIT Is, and How It Differs from Owning a Property
A REIT (Real Estate Investment Trust) is a trust that owns income-producing property and splits the rent among thousands of unit holders. In Australia these are called AREITs and they trade on the ASX like shares. Moneysmart covers them under property funds.
How it works, step by step
- The trust raises money from investors (units) and banks (debt). Sector gearing averaged 28.6% in FY25, close to its long-run level of about 30%.
- It buys large properties: shopping centres, logistics warehouses, offices, childcare centres, data centres.
- Tenants pay rent. The trust pays its costs and interest, then passes most of the income to unit holders as distributions, usually quarterly or half-yearly.
- A professional manager handles leasing, repairs, valuations and buying or selling buildings.
- The unit price moves every trading day with the market’s view of rents, interest rates and property values. It can sit above or below the trust’s net tangible assets (NTA); the median AREIT traded at an 11.9% discount to NTA in FY25.
You could buy units of a single AREIT (for example Goodman, Scentre, Charter Hall Group; named as examples, not recommendations) through any share broker, or an index exchange-traded fund (ETF) that holds the whole sector. Vanguard’s VAP, the largest, tracks the S&P/ASX 300 A-REIT Index for a 0.23% annual fee.
2. AREITs vs Direct Property: 20-Year Performance
Over 20 years the typical investment home compounded at 9.16% a year, almost double the 5.05% earned by AREITs. Most of that gap traces back to one event inside the window: the Global Financial Crisis (GFC).
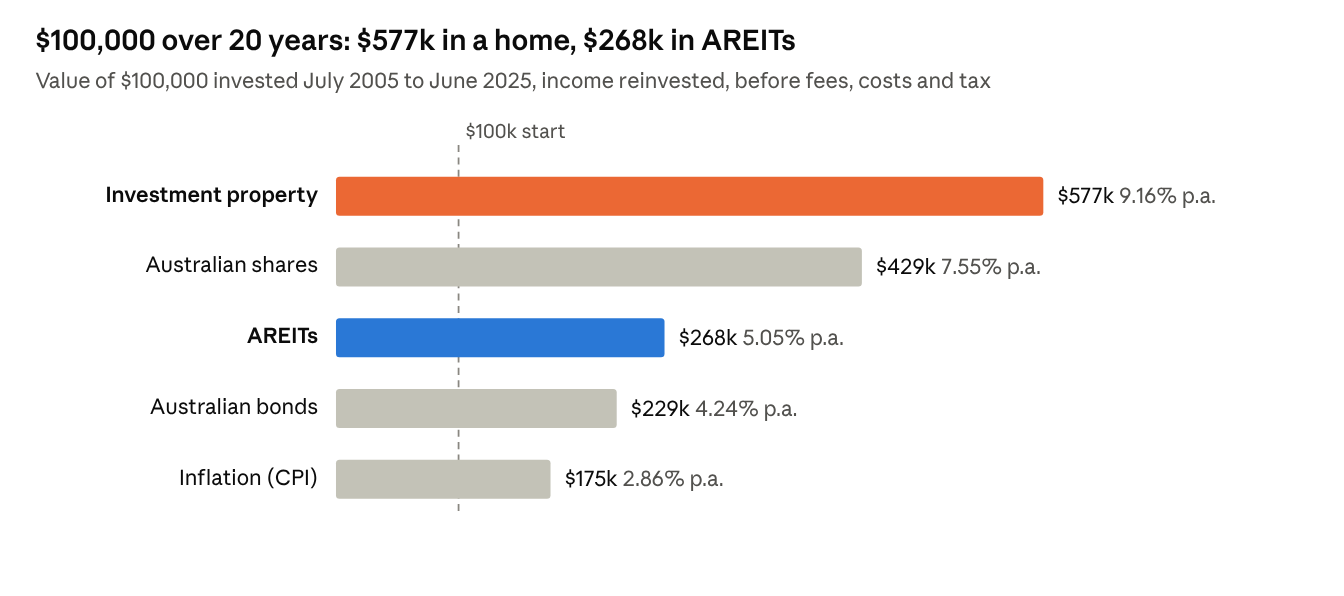
Chart 1 · Livewire Long Term Investing Report 2025 chart pack: Cotality Hedonic Total Return Index (investment property), S&P/ASX 200 A-REIT TR Index, FY2006–FY2025. Annual rates as reported.
Looking at the figure, it may seem there is no point putting money in AREITs. However, it is worth understanding what caused the performance to diverge so widely.
- The GFC wiped out half the AREIT sector. Listed trusts fell about 55% as pre-GFC gearing above 40% met a credit freeze. Many raised equity at the bottom, locking in losses for existing holders. Housing had no comparable collapse; its worst national fall on record is 8.4% (May 2022 to January 2023).
- The property line is flattered. The Cotality index adds gross rent to price growth. It ignores stamp duty, agent fees, rates, insurance, repairs and vacancies. Net yields on houses typically run 1 to 1.5 percentage points below gross, so a realistic net figure is closer to 7.5–8% a year.
- Housing had a once-in-a-generation tailwind. The cash rate fell from 5.50% in 2005 to 0.10% in 2020, which pushed home prices up 28.9% in just 20 months from September 2020.
The smoothing trap
Direct property looks calmer partly because nobody prices your house every day. Valuers update slowly, so falls show up late and small. For example, in the year to September 2020, the MSCI/Property Council index of directly held commercial property still showed a +0.9% return, while listed AREITs owning similar buildings had dropped about 20%. Same assets, different measuring stick.

3. AREITs vs Direct Property: Benefits and Risks Side by Side
The two routes trade off the same few things: how much it takes to start, how steady the income is, how fast you can get out, and how much one asset can hurt you.
| Item | AREIT (listed / ETF) | Direct property |
|---|---|---|
| Initial capital | From one unit (~$90); no stamp duty | Estimated ~$193,000 for an $800,000 NSW home: 20% deposit, ~$30,200 stamp duty, ~$3,000 legal |
| Transaction cost | Brokerage ~$10; ETF fee 0.23% a year | Stamp duty ~3.8% to buy, agent ~2% to sell; round trip roughly 6% of value |
| Cash flow | Distributions of roughly 3–5% a year, paid quarterly; no top-ups needed | Gross yield ~3.85% minus costs; with an 80% loan at 6%, usually negative (you top up) |
| Borrowing | Built in at ~29% gearing inside the trust; personal borrowing costly | You choose it, typically 80%; magnifies gains and losses |
| Liquidity | Sell any business day, cash in 2 days | 2–6 months to sell; all-or-nothing |
| Diversification | VAP holds ~25 AREITs, hundreds of buildings across retail, industrial, office | One building, one suburb, one tenant |
| Concentration | Index is top-heavy: Goodman Group is ~35% of VAP | 100% in one asset |
| Control | None; manager decides | Full: renovate, choose tenants, pick timing |
| Price swings | Repriced every second; falls of 20–55% have happened | Valued rarely; recorded falls far smaller, but real risk is hidden, not absent |
| Tax | Flow-through, partly tax-deferred; no land tax bill for you | Negative gearing offsets salary; depreciation; land tax above thresholds |
| Effort | Minimal; the manager runs the buildings | Tenants, repairs, insurance, compliance |
| Main risks | Interest-rate shocks, sector cycles (office), discount to NTA, equity raisings at lows | Vacancy, a bad tenant, rate rises on your loan, forced sale, local oversupply |
Despite holding the same kind of underlying asset, AREITs and direct property differ significantly, especially in initial capital, management effort and liquidity. AREITs may not match direct property on total return, but they give investors liquidity, a small minimum investment and little trouble managing the real assets.
Not sure how this applies to you?
Start with a free Financial Health Check™ — a simple way to see where you stand before any advice is given.
4. Which One Suits You?
Neither is better in general; each suits a different investor. The fit depends on your capital, your need for access to cash, and how much single-asset risk you can stomach.
Many investors hold both: a home or one investment property for borrowing power and control, plus an AREIT ETF for liquidity, diversification and exposure to commercial sectors. Whichever route you choose, judge it on the after-cost, after-tax, risk-adjusted outcome, not the headline index return.
FAQ
Have AREITs or direct property performed better over 20 years?
On the headline index, investment homes returned 9.16% a year and AREITs 5.05% over the 20 years to June 2025. After costs, the property figure is closer to 7.5–8% a year, and much of the gap traces back to the GFC.
How much does it cost to start with AREITs vs direct property?
AREITs start from one unit (about $90). An $800,000 NSW investment home needs an estimated ~$193,000 up front, including a 20% deposit, stamp duty and legal costs.
Are AREITs riskier than direct property?
AREIT prices move every trading day, and falls of 20–55% have happened. Direct property is valued rarely, so recorded falls are smaller, but the risk is hidden, not absent.
Sources
- Livewire, The best performing asset classes over 20 years (Oct 2025) — 20-year returns (9.16%, 7.55%, 5.05%), AREIT GFC fall ~55% and 2020 fall ~20%, methodology; Chart 1, Chart 2, Section 2
- Livewire Long Term Investing Report 2025 chart pack (PDF) — value of $100,000 after 20 years, index definitions; Chart 1
- BDO A-REIT Survey 2025 — FY25 return 10.3%, gearing 28.6%, median discount to NTA −11.9%; Sections 1 and 2
- BDO media release on the 2025 A-REIT survey — FY24 return 19.9%; Section 2
- Livewire, Have A-REIT risks been overblown? — pre-GFC gearing above 40%; Sections 2 and 3
- CoreLogic, Australian home values record the largest decline on record (Jan 2023) — −8.40% and −8.38% falls, 28.9% upswing; Chart 2, Section 2
- Property Council/MSCI index, Q3 2020 update — +0.9% direct commercial return to Sep 2020; Section 2
- Australian Property Update, Cotality rents and yields (2026) — national gross yield 3.85% (Sep 2026); Sections 2–4
- Mozo, how to calculate rental yield — net yield 1–1.5 points below gross for houses; Section 2
- Review ETF, VAP review and P&I ETF fact sheet, VAP — 0.23% fee, ~25 holdings, Goodman ~35% weight; Sections 1 and 3
- Austax NSW stamp duty calculator (2026–27 rates) — $30,187 duty on $800,000; Sections 3 and 4
Next step
Talk through your retirement plan
We can model how the rules in this guide apply to your situation, across super, investments and your other assets.
Start with a free Financial Health Check™
General information only. Personal advice requires an agreed scope and may need a Statement of Advice (SOA) or Record of Advice (ROA). Fees are agreed in writing before you start.
Tax, superannuation, and regulatory information in this article is based on legislation and ATO/ASIC guidance current as of 2026. These rules are complex and subject to change, and this article is not updated retrospectively when they do. This information is a general summary only and should not be relied upon as formal tax advice — always confirm current rules with a registered tax agent or the ATO directly.
General Advice Warning: This information is general in nature only and does not constitute personal financial, legal, or tax advice. It has been prepared without taking into account your objectives, financial situation, or needs. Before acting on any information, consider whether it suits you and seek advice from a licensed financial adviser and registered tax agent. Past performance is not a reliable indicator of future performance.
This article is published jointly by Infinite Zephyr and Vietinvest.au, both under NDT Capital Pty Ltd (AFSL 558899). Infinite Zephyr is an Authorised Representative (AR 001268024) and Vietinvest.au is a Corporate Authorised Representative (CAR 001311348) of NDT Capital. You can verify these authorisations on the ASIC Financial Advisers Register. For dispute resolution, contact the Australian Financial Complaints Authority (AFCA).